Free Price Competition Analysis Template (2026)
Track competitor pricing across any sales channel with this free Excel template. Two tabs, 27+17 fields — from retail price comparison to MAP compliance monitoring.

Free Price Competition Analysis Template (2026)
TL;DR
- Compare prices across Amazon, Best Buy, Walmart, and brand sites in one spreadsheet
- Flag MAP violations instantly with color-coded alerts in the Professional tab
- Spot pricing trends with 90-day price history and automatic rank calculations
- Download the free template and start tracking in under 10 minutes
Quick Answer
Tracking competitor prices manually is slow, incomplete, and inconsistent. This free Excel template gives teams a structured way to compare pricing across every sales channel, flag MAP violations, and spot pricing trends — all in one place. Download the template, enter your products, and turn scattered price checks into a repeatable system.
What Is a Price Competition Analysis?
Price competition analysis is the practice of tracking what competitors charge for the same or similar products — and understanding what those prices mean for a business. It goes beyond a simple price check. A competitor pricing analysis looks at regular prices, sale prices, discounts, shipping costs, bundle offers, and even return policies. The goal is to know exactly where a product stands in the market. A proper competitor price analysis excel template makes this process repeatable instead of relying on memory.
Most businesses do this in their heads or in scattered spreadsheets. A sales manager might check Amazon once a week. A pricing team might remember that "competitor X is usually 10% cheaper." But memory fades, prices change daily, and channels multiply. Without a structured system, pricing decisions become guesses.
How the Template Works: Signal → Insight → Action
This template follows a simple three-step framework:
Step 1 — Capture the Signal. Enter competitor product data across all sales channels. The 27-column Standard tab catches everything: pricing, promotions, shipping terms, stock levels, and customer reviews.
Step 2 — Turn It Into Insight. The template calculates key metrics automatically. Price rank shows where a product sits in the market. Value score combines price, reviews, and shipping into one number. The Professional tab adds MAP compliance tracking, gross margin estimates, and 90-day price history.
Step 3 — Take Action. When the data shows a competitor dropped their price by 20%, the team can respond the same day. When MAP violations appear, the alert column flags them instantly. No more waiting for a monthly report.
Old Templates vs This 2026 Template: What's Different
| Dimension | Old Way | This Template |
|---|---|---|
| Structure | A single sheet with product name and price. Three columns, manually updated when someone remembers. No price history, no channel comparison, no margin tracking. | Two dedicated tabs with 27 + 17 structured fields. Every column has a clear purpose. Sample data shows exactly how to fill it in. |
| Pricing Decisions | Based on gut feeling and "last quarter's pricing." | Backed by price rank, value score, and market position. The Professional tab even estimates gross margin per channel. |
| MAP Compliance | MAP violations discovered weeks later, after the damage is done. | Real-time MAP compliance checks. The Price Alert column flags "Below MAP" and "Lowest Ever" pricing with color-coded badges. |
| Price Trends | No way to spot pricing trends. | Tracks 90-day price history and calculates change percentages. A rising competitor price means room to increase. A dropping trend signals a price war. |
Real Results from Pricing Teams
An electronics retailer used the Standard tab to track five headphone models across four sales channels. Within two weeks, they identified that Best Buy was consistently undercutting their Amazon listings by 15%. The team adjusted pricing and recovered $12,000 in monthly margin.
A home appliance brand discovered through the Professional tab that two of their authorized retailers were selling below MAP on three product lines. The coupon and bundle columns revealed the pattern: retailers were stacking hidden discounts. The brand enforced MAP compliance and protected $85,000 in annual channel revenue.
A consumer goods company used the 90-day price history to time their own promotions. When the data showed competitors raising prices in Q1, they held steady and gained 4% market share by being the lowest-price option during peak buying season.
Sheet-by-Sheet: What's Inside
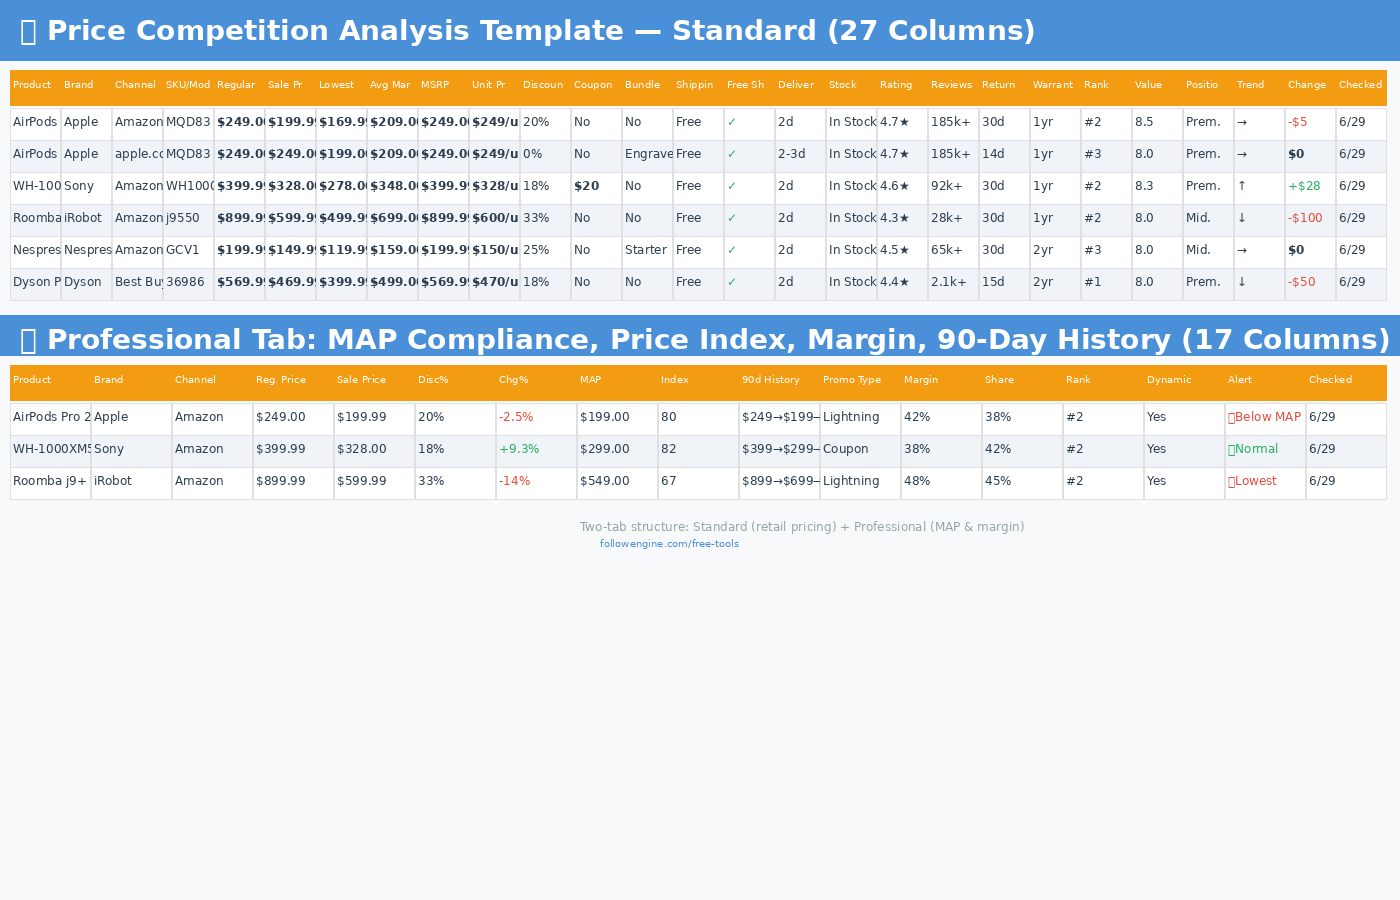
Standard Tab — 27 Columns
This is the everyday pricing dashboard. It covers the full retail picture:
- Product & Brand — What's being tracked and who makes it
- Channel — Where it's sold (Amazon, Best Buy, brand site, Walmart)
- SKU/Model — The exact identifier so there's no confusion
- Regular Price / Sale Price / Lowest Price — Current pricing in three dimensions
- Avg Market Price / MSRP — Context for where the price sits
- Unit Price — Normalized per-unit cost for fair comparison
- Discount / Coupon / Bundle — Every promotion type tracked separately
- Shipping Cost / Free Shipping / Delivery Time — Total cost to customer
- Stock Status — In stock, low stock, or out of stock
- Rating / Reviews — Customer sentiment at a glance
- Return Policy / Warranty — Post-purchase terms that affect perceived value
- Price Rank / Value Score / Market Position — Calculated competitive standing
- Price Trend / Price Change / Last Checked — Change tracking over time
The sample data includes five real products: AirPods Pro 2, Sony WH-1000XM5, Roomba j9+, Nespresso Vertuo, and Dyson Purifier — each tracked across multiple channels.
Professional Tab — 17 Columns
Built for pricing analysts and brand managers who need deeper competitor price monitoring intelligence. This tab is the command center for MAP compliance monitoring:
- MAP Price — The minimum advertised price. The alert column flags any retailer selling below it.
- Price Index — A 0-100 score showing where this listing sits in the market. 100 = at MSRP. 67 = 33% below MSRP.
- Price History (90d) — A compressed view of how the price moved over the last quarter. Instantly spot trends.
- Gross Margin Estimate — Approximate margin after channel costs, useful for comparing channel pricing strategy across retailers.
- Market Share / Competitor Rank — Where this listing stands relative to others.
- Dynamic Pricing — Yes/No flag for algorithmic pricing.
- Price Alert — Color-coded: 🔥 Below MAP, ⚠ Near Low, ✅ Normal.
How to Use the Template: Step by Step
1. Pick Your Products. List every product that competes directly with competitors. Start with the top 5-10 products that drive the most revenue. The template includes five sample products to show the format.
2. Identify Sales Channels. For each product, list every channel where it's sold. This includes marketplaces like Amazon, big retailers like Best Buy and Walmart, and the brand's own website. More channels mean more complete price tracking tool data.
3. Fill in Pricing Data. Enter regular price, sale price, and the lowest price seen. Be specific — a $249.00 product listed at $199.99 tells a different story than one at $239.99.
4. Add Promotion Details. Record every discount, coupon, and bundle offer separately. A 20% discount plus free shipping is very different from 20% off plus a $10 coupon plus a free accessory bundle.
5. Track Shipping and Stock. Shipping cost and delivery time change the total cost to the customer. Stock status signals whether a low price is sustainable or a clearance move.
6. Monitor Reviews and Ratings. Customer sentiment affects perceived value. A product with 4.7 stars and 185,000 reviews commands a premium. One with 4.2 stars and 500 reviews does not.
7. Use the Professional Tab. Switch to this tab for MAP compliance, margin estimates, and 90-day price history. The price alert column does the monitoring — the team only needs to act when something turns red.
8. Update Weekly. Set a recurring calendar slot. Spend 15 minutes updating prices for the products that matter. The competitor price tracker data gets better with consistency.
Common Problems and How This Template Prevents Them
1. Competitor Drops Price — Team Finds Out a Week Later. The Last Checked column forces a date stamp. The Price Change column shows the dollar movement. No more discovering price drops during the quarterly review.
2. MAP Violations Go Unnoticed for Months. The Professional tab has a dedicated MAP Price column and a Price Alert column. When a retailer drops below MAP, the alert says "🔥 Below MAP." The brand team sees it the same day.
3. Discounts Look Bigger Than They Really Are. A 25% discount with free shipping is $149.99. A 20% discount with a $10 coupon and a free accessory bundle is $189.99. The template separates discount, coupon, and bundle into three columns so the team sees the real number.
4. Pricing Decisions Based on One Channel. A product might be $199.99 on Amazon but $249.00 on the brand site. Without channel comparison, the brand never knows it's leaving money on the table. The template puts every channel side by side.
5. No Historical Context for Price Changes. A price cut from $399 to $328 might look aggressive — until the 90-day history shows it was $278 two months ago. The Professional tab provides this context so teams don't overreact.
6. Hidden Shipping Costs Skew Comparisons. Competitor A lists at $199.99 with free 2-day shipping. Competitor B lists at $179.99 with $15.99 shipping and 5-7 day delivery. The template captures all these details so the comparison is fair.
FAQ
What is price competition analysis? It's the process of collecting and comparing competitor pricing data to understand market position and make informed pricing decisions. A competitive pricing spreadsheet turns this from a monthly scramble into a weekly habit.
How many products can this template track? The template includes sample rows for five products across multiple channels. Teams can add as many rows as needed — just copy the format down.
What's the difference between the Standard and Professional tabs? The Standard tab covers everyday retail pricing: price, discounts, shipping, reviews. The Professional tab adds MAP compliance, gross margin estimates, price index scoring, and 90-day price history.
How often should the data be updated? Weekly is the recommended minimum for most businesses. High-velocity categories like electronics might need daily updates during peak seasons.
Can this template track prices automatically? The template is manual entry. For automated real-time price monitoring, a dedicated competitive intelligence tool can track prices across channels and alert teams when competitors change pricing.
What is MAP and why does it matter? MAP stands for Minimum Advertised Price — the lowest price a brand allows retailers to advertise. When retailers sell below MAP, it damages the brand's perceived value and upsets channel partners. The Professional tab helps enforce MAP compliance.
How does the Value Score work? The Value Score combines price, rating, review count, shipping terms, and return policy into a single 0-10 number. Higher scores mean better overall value for the customer. It helps identify which listings are genuinely competitive.
What does the Price Index tell me? Price Index is a 0-100 score where 100 = at MSRP and lower numbers mean deeper discounts. A Price Index of 67 means the product is selling at 33% below MSRP — useful for quick competitive scans.
Can I customize the columns? Yes. The template is an open Excel file. Add or remove columns to match specific business needs. The structure is a starting point, not a constraint.
How does this compare to automated pricing tools? Automated tools pull prices in real time and send alerts. This template is for teams that need a structured, free way to organize manual price tracking before investing in automation.
What if competitors use dynamic pricing? The Professional tab has a Dynamic Pricing flag. When a competitor uses algorithmic pricing that changes multiple times per day, flag it and switch to automated monitoring for that product.
Should the brand's own website be included in the comparison? Yes. Including the brand's own site shows whether direct sales pricing is competitive with marketplace pricing. Many brands discover their own site is the highest-priced channel.
How do shipping costs affect price comparison? Two products with the same list price but different shipping terms have different total costs. The template captures shipping cost, free shipping thresholds, and delivery time to enable apples-to-apples comparison.
What's the best way to find competitor prices? Visit competitor websites and marketplace listings directly. Check once a week at the same time. For systematic competitor price research, competitive intelligence platforms can automate the data collection.
Can this template help with promotional planning? Yes. The 90-day price history in the Professional tab shows when competitors typically run promotions. The Discount, Coupon, and Bundle columns reveal the types of promotions competitors use most.
Does the template work for B2B pricing? Yes. The structure works for any product with a list price. For B2B, replace MSRP with contract price and add a Volume Discount column. The core logic stays the same.
What happens when a competitor has a permanent price change? The Price Change column captures the dollar amount. The 90-day history shows the trajectory. If a competitor permanently lowers their price, the trend line will show a sustained drop rather than a temporary sale.
How does stock status affect pricing decisions? A competitor showing "Low Stock" at a low price is likely clearing inventory. A competitor showing "In Stock" at a low price is likely making a strategic move. The Stock Status column provides this context.
Should the team track every SKU or just top products? Start with the top 10-20 products by revenue. Expand as the process becomes routine. Tracking 500 SKUs manually is overwhelming. Tracking 20 well is actionable.
What if competitors sell different bundle configurations? The Bundle column captures this. A competitor might sell a vacuum with free tools included, while another sells it standalone at a lower price. The template makes these differences visible.
Free Excel template. Open in Excel, Google Sheets, or any spreadsheet tool. No sign-up required.
About the Author
Dylan Dan Founder & CEO, FollowEngine
Dylan Dan is the founder of FollowEngine, bringing over 10 years of experience in competitive intelligence and competitor analysis. He has helped hundreds of businesses build structured CI programs that turn market signals into revenue decisions.
Related Articles
- [Free SWOT Competitor Analysis Template (2026)](/blog/free-swot-competitor-analysis-template-2026)
- [The Free SaaS Competitor Analysis Template That Ships — 10 Fields, 3 Tabs, One Weekly Habit](/blog/the-free-saas-competitor-analysis-template-that-ships-10-fields-3-tabs-one-weekly-habit)
- [How to Actually Use ChatGPT for Competitive SEO Analysis (2026)](/blog/how-to-actually-use-chatgpt-for-competitive-seo-analysis-2026)
Next step
Find your real competitors.
Run a free competitor lookup and decide what to monitor next.