The Free SaaS Competitor Analysis Template That Ships — 10 Fields, 3 Tabs, One Weekly Habit
A free competitor analysis template purpose-built for B2B SaaS teams. 10 fields, 3 tabs, dark-mode design — complete in 15 minutes per week.

The Free SaaS Competitor Analysis Template That Ships — 10 Fields, 3 Tabs, One Weekly Habit
TL;DR
- Track 10 key fields per competitor — from pricing and positioning to AI capabilities
- Three dedicated tabs: MVP Tracking Grid, feature Comparison Matrix, and fully populated Example tab
- Built for B2B SaaS teams — complete in 15 minutes per week, feeds directly into battlecards and pricing reviews
- Free .xlsx download, no email gate, no sign-up required
Quick Answer
SaaS competitor tracking usually means scattered notes, overdue spreadsheets, and last-minute scrambles before board meetings. This free template replaces all of that with a structured, 10-field system purpose-built for B2B SaaS teams. Track pricing, positioning, integrations, and AI capabilities — in 15 minutes a week — and feed the data directly into sales battlecards, pricing reviews, and exec updates.
📥 Download the Free Template (.xlsx) → No email required. No credit card. Open the file and start populating competitor data immediately.
Why Most Free SaaS CI Templates Sit Empty After Week One
The typical scenario plays out in product marketing teams and founder-led startups alike. A board meeting triggers the question: "What are competitors doing?" Someone downloads a free spreadsheet from a search result. The file opens to 35 columns — mission statement, revenue estimate, market share, five-year projection, SWOT quadrants, 4 Ps. The team populates three rows in an afternoon. Nobody touches it again.
Six months later, a sales rep loses a deal to a competitor that just launched a feature the team missed. The excel competitor analysis template is still in the shared drive — three rows filled, 32 columns blank.
The failure isn't the team. The failure is a template designed for a one-off MBA strategy project, not for the weekly rhythm of a SaaS competitive intelligence program. Per Crayon's 2024 State of Competitive Intelligence report, 65% of B2B software opportunities are competitive — yet 41% of CI leaders report their sales team rarely uses the battlecards they already have. The gap sits between the template and the workflow.
Signal → Insight → Action
A competitor analysis template only earns its place when every field drives a decision downstream. The free template shipped here follows a three-stage model:
| Stage | What happens | Template mapping |
|---|---|---|
| Signal | Detect a competitor change — pricing update, new positioning, hiring surge, feature launch | Fields 1-6 (Competitor Name, Website, Pricing, Positioning, Target Customer, Key Features) |
| Insight | Interpret the signal — what does this move say about their strategy, their gap, or their pressure point? | Fields 7-9 (Differentiator, Stage/ARR, Hiring Signal) |
| Action | Decide what to do — update a battlecard, trigger a pricing review, adjust positioning, or deprioritize | Field 10 (Status: Active / Watching / Deprioritized) |
Every signal maps to an insight, and every insight triggers an action. No field exists "just in case somebody asks." The template's opinionated brevity is its primary feature.
What a SaaS Competitor Analysis Template Actually Is
A competitor analysis template is a decision-input document, not a research archive. The useful version has three properties:
- Small enough to fill weekly. A 10-field grid takes 90 minutes for the first competitor and 20 minutes per additional competitor after the data-source muscle memory forms.
- Opinionated about what to leave out. No mission statement column. No revenue guesswork. No SWOT quadrants. Every field must answer the question: "Would a sales rep, in the middle of a competitive deal, ever ask for this cell?"
- Connected to a downstream output. A populated grid that feeds nothing is a hobby. The grid must feed at least one of: a battlecard, a pricing review, a board update, or a positioning refresh.
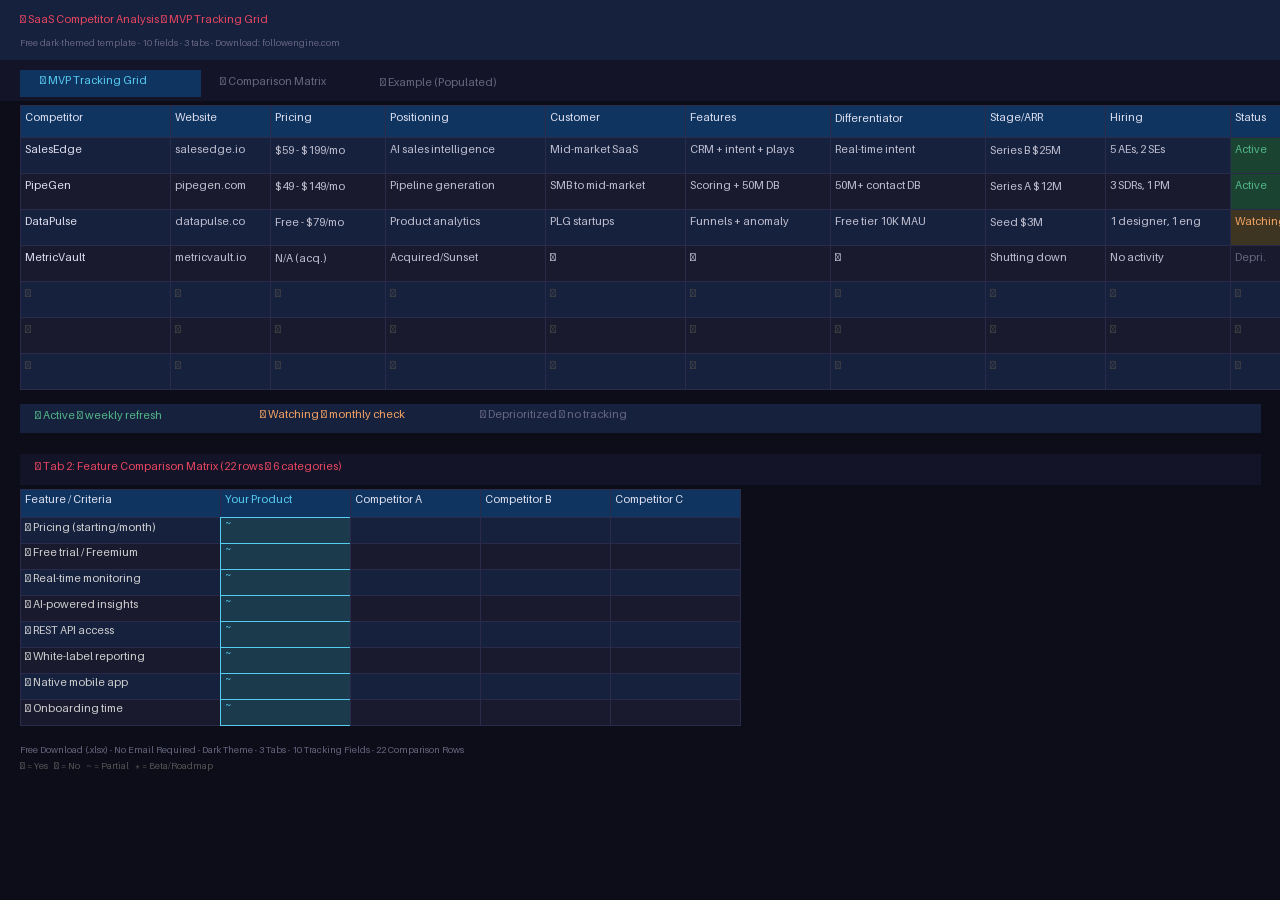
The file described in this article — the free SaaS CI program template — is built around these three constraints. Three tabs, 10 fields, color-coded Status with green/amber/gray visual signals, frozen headers, and auto-filter.
The 10-Field MVP Tracking Grid
Tab 1 of the downloadable file contains the core grid. Each of the 10 fields maps to a specific CI question and a refreshed cadence that keeps the sheet alive.
| # | Field | What it captures | Source | Cadence |
|---|---|---|---|---|
| 1 | Competitor Name | Company + website URL | Direct entry | Static |
| 2 | Website | Primary domain | Direct entry | Static |
| 3 | Pricing (Starter / Pro) | Free tier, per-seat, usage-based, enterprise quote | Pricing page + Wayback Machine | Weekly |
| 4 | Positioning (1-line) | Their hero claim — verbatim if possible | Homepage H1 + meta description | Monthly |
| 5 | Target Customer | Segment, company size, buyer role | "For" sections, customer logos | Quarterly |
| 6 | Key Features (top 3) | Lead capabilities they push in marketing | Product tour, changelog, launch posts | Monthly |
| 7 | Main Differentiator | What they claim makes them unique | Homepage, comparison pages | Monthly |
| 8 | Stage / ARR | Funding round, estimated ARR range | Crunchbase, LinkedIn, press | Quarterly |
| 9 | Hiring Signal | Role count, department focus, source | LinkedIn jobs filtered to product + engineering | Weekly |
| 10 | Status | Active / Watching / Deprioritized | Owner judgment | Weekly review |
The template caps at 7 competitor rows. The Status column enforces a decision — if a competitor hasn't moved in three months and no deal has mentioned them, they move from Active to Watching. The grid stays clean.
The Three Tabs: MVP Grid, Comparison Matrix, Example
The free download ships with three opinionated tabs, each serving a distinct job in the competitor tracking workflow.
Tab 1 — MVP Tracking Grid
The weekly-operations tab. Ten fields, seven competitor rows, color-coded Status column (green = Active, amber = Watching, gray = Deprioritized). Frozen headers. Auto-filter. Built to be opened every Monday for a 15-minute refresh.
Tab 2 — Comparison Matrix
The head-to-head battlecard generation input. Twenty-two feature rows organized into six categories — Pricing & Plans, Core Features, Integrations, Advanced Capabilities, Platform, and Support & Onboarding. The matrix compares your product against up to three competitors using ✓ (Yes), ✗ (No), ~ (Partial), and \* (Beta/Roadmap). Your product column is visually highlighted. Sales teams copy from this tab directly into battlecards.
Feature categories in the matrix:
- Pricing: Starting price, free trial, usage-based options
- Core: Real-time monitoring, battlecard auto-generation, review sync, intent data, AI insights
- Integrations: Slack/Teams, REST API, CRM (SFDC/HubSpot), email sequencing
- Advanced: Churn prediction, win/loss analysis, white-label reporting, custom fields
- Platform: Native mobile app, SSO/SAML, multi-language support
- Support: Onboarding time, support tier, knowledge base
Tab 3 — Example (Populated)
Seven fictional SaaS companies filled into every cell — SalesEdge (sales intelligence), PipeGen (pipeline generation), ChurnZero (customer success AI), DataPulse (product analytics), SupportBot (AI chatbot), ScaleOps (cloud cost optimization), and MetricVault (acquired). The fake data demonstrates what a completed row looks like: pricing cells include both model and number, positioning rows are one sentence each, and Status colors do real sorting work. Replace the fictional names with the actual competitive landscape and the structure remains identical.
Signal → Insight → Action: The Weekly Workflow
The template is designed around a three-stage weekly rhythm. Total time investment: 90 minutes for the first competitor, 20 minutes per additional competitor, and 15 minutes per week for maintenance.
Stage 1 — Signal Detection (15 min / week)
Three fields drift fastest in SaaS and are checked weekly: Pricing, Hiring Signal, and Positioning.
- Pricing: Open the competitor's pricing page. Screenshot it. Check the Wayback Machine for the prior version. A pricing change is the most actionable signal in competitor monitoring — it signals new market tier targeting, a land-grab, or margin pressure.
- Hiring Signal: Search the competitor on LinkedIn Jobs, filter to product and engineering roles. A hiring surge often precedes a feature launch by 8–12 weeks.
- Positioning: A Google Alert on the company name surfaces homepage copy changes. When three competitors converge on the same positioning claim, the differentiation cell on your own product is at risk.
Stage 2 — Insight Formation (monthly review)
The monthly review synthesizes weekly signals into strategic insights. The process asks three questions per active competitor:
- What changed? — Specific field-level deltas since the last review.
- What does it mean? — Strategic interpretation tied to market dynamics.
- Who needs to know? — Sales (battlecard update), Product (feature roadmap input), Leadership (board slide).
Stage 3 — Action Output
A populated grid feeds exactly one downstream artifact per review cycle. The most common outputs and their template-to-output mapping:
| Template input | Downstream output | Cadence |
|---|---|---|
| Pricing + Features + Positioning | Sales battlecard (1-pager per top competitor) | Monthly |
| Change log across Active competitors | CI report for leadership (2-page summary) | Monthly |
| Positioning field (when 3+ converge) | Positioning review trigger | As needed |
| Pricing field (across tracked set) | Pricing committee input (snapshot) | Monthly |
If the grid didn't produce at least one of these this month, the CI program isn't a program — it's a side project without ROI.
Comparison: This Template vs. Generic 35-Column Grids
The five most-downloaded free competitor comparison templates from Asana, Atlassian, Smartsheet, ProjectManager, and Canva share a common bloated structure. Below is a side-by-side comparison of the 14 most common padding fields and why each is noise for SaaS CI.
| Field in generic template | Why it looks useful | Why it's noise for SaaS CI |
|---|---|---|
| Date completed | Audit trail | Already lives in file version history |
| Analyst / owner name | Accountability | One owner per sheet, not per row |
| Competitor tier / weight | Prioritization | Subjective; use Status dropdown instead |
| Mission statement | "Strategic context" | Rarely changes a deal outcome |
| Key objectives | Strategy framing | Unknowable for private companies |
| Revenue | Quantifies threat | Unavailable or wrong for private SaaS |
| Market share | Competitive ranking | Guesswork outside large public markets |
| Place / distribution | 4 Ps habit | B2B SaaS distributes online |
| People / staffing | "Operational signal" | Use hiring-signal field instead |
| Process / fulfillment | Process maturity | Irrelevant to SaaS battlecards |
| Physical evidence | 4 Ps habit | Doesn't apply to software |
| Social follower counts | Brand traction | Vanity metric |
| Visual positioning map | "Strategic clarity" | Takes an hour; nobody reads it |
| Company size | Scale context | Crunchbase has it on demand |
The test: Would a sales rep, mid-deal with a named competitor, ever ask for the value in the cell? If the answer is no, the field belongs in the cut list, not the template.
Common Failure Modes (and the Fix for Each)
Four patterns reliably kill competitor research template programs. Each has a specific, mechanical fix built into the free template.
| Failure mode | Symptom | Fix |
|---|---|---|
| Stale data | Entries months old; nobody owns refresh | One named owner, calendar reminder, Status column flags rows older than 30 days |
| Competitor bloat | List grows to 20+; nothing refreshed | Cap Active at 5-7; overflow lives in a Watching sheet |
| No handoff | Grid sits in a drive nobody opens | Feed it into a battlecard or board update on a fixed cadence |
| Field creep | Someone adds five more columns "to be thorough" | Every new field needs a stated use case; if it's "in case someone needs it," cut it |
The template's opinionated design — 10 fields, 7 rows, color-coded Status — imposes these constraints structurally. The file resists bloat because there's no room for it.
FAQ
What should a competitor analysis template include?
The minimum viable competitor analysis template includes 10 fields: competitor name, website, pricing model, one-line positioning, target customer profile, top three key features, main differentiator, stage/ARR estimate, hiring signal, and a Status dropdown (Active / Watching / Deprioritized). Anything beyond these 10 fields must pass the "would a sales rep ask for it mid-deal" test. The free FollowEngine template contains exactly these 10 fields across three tabs — the MVP tracking grid, a 22-row comparison matrix, and a fully populated example with seven fictional SaaS companies.
How is this different from the generic 35-column templates on search results?
The generic templates are designed for a one-off MBA competitive analysis assignment — mission statements, SWOT quadrants, five-year revenue projections, and 4 Ps frameworks built for retail. The free FollowEngine template is purpose-built for SaaS: it drops 14 noise fields proven to sit empty, adds a Signal → Insight → Action workflow, color-codes the Status column for visual scanning, and includes a 22-row comparison matrix organized by SaaS-relevant categories (SSO, API access, mobile app, churn prediction, CRM integration). The 10-field grid takes 15 minutes per week to maintain, not an afternoon twice a year.
What is the Signal → Insight → Action framework?
Signal → Insight → Action is a three-stage CI workflow embedded in the template's field design. Stage 1 (Signal) captures competitor changes — pricing updates, hiring surges, positioning shifts — through weekly checks on the three fastest-drifting fields. Stage 2 (Insight) interprets what those signals mean: a pricing drop signals market-share grab, a hiring surge in engineering signals an upcoming feature launch. Stage 3 (Action) maps each insight to a specific downstream output: a battlecard update, a pricing review trigger, or a board-level CI report. The framework ensures the grid produces a decision every cycle, not just a data archive.
How often should a competitor analysis be updated?
Three fields drift weekly and require a 15-minute check: pricing, hiring signals, and positioning. The remaining fields (ICP, key features, differentiator, stage) hold steady on a monthly cadence. Per Crayon's 2024 CI report, "keeping content fresh" is the most-cited challenge across CI programs — frequent short checks are more reliable than heroic quarterly rewrites. The free template's color-coded Status column visually flags Active rows that haven't been touched in 30 days.
Is this template really free?
Yes — fully free. The Excel .xlsx file downloads directly with no email gate, no credit card requirement, and no "request access" friction. All three tabs (MVP Tracking Grid, Comparison Matrix, Example) are included in a single file. The dark-mode styling, frozen headers, auto-filter, and conditional Status formatting are all pre-applied — open the file and start populating competitor data immediately.
What Excel features does the template use?
The template uses conditional formatting (green/amber/gray for the Status column), frozen panes (header rows locked in all three tabs), auto-filter (on the MVP Grid and Example tabs), and sheet tab color-coding (blue for MVP Grid, red for Comparison Matrix, green for Example). All formatting works in both Excel and Google Sheets (File → Open → Upload), though color shades may render slightly differently in Sheets' default theme.
What's the difference between competitor analysis and competitor research?
Competitor research is the discovery phase — identifying who plays in the space, scoping the landscape, and deciding which companies to track. Competitor analysis is the ongoing evaluation of a defined set of competitors against dimensions that drive decisions. Research produces a shortlist of 15–20 names. Analysis runs on 5–7 Active competitors and produces battlecards, pricing snapshots, and board updates.
From Template to Program
A free pricing tracking template only delivers ROI when it becomes a weekly habit. The file described here is small enough to make that realistic: 10 fields, 7 competitor rows, three tabs, one named owner, and a 15-minute Monday check on pricing, hiring signals, and positioning.
But here's the thing — before filling in a single row, you need to know which competitors to track. The free template is the canvas; FollowEngine's competitor monitoring tool is the paint.
Two steps to go from zero to a live CI program today:
- Identify your real competitors. Open FollowEngine's free Competitor Finder — type your domain, and instantly see which companies compete for your keywords, traffic, and market positioning. No guesswork. No "I think they might be a competitor." Real data.
- Add them to your dashboard. Once identified, every competitor goes into your live monitoring dashboard — pricing changes, feature launches, hiring signals, and positioning shifts surface automatically. No manual Wayback Machine checks. No LinkedIn tab-hopping.
Then open the free template, copy the dashboard findings into the MVP Tracking Grid, and run your first 15-minute weekly refresh. The template keeps you organized. FollowEngine keeps you informed.
About the Author
Dylan Dan Founder & CEO, FollowEngine
Dylan Dan is the founder of FollowEngine, bringing over 10 years of experience in competitive intelligence and competitor analysis. He has helped hundreds of businesses build structured CI programs that turn market signals into revenue decisions.
Related Articles
- [Free SWOT Competitor Analysis Template (2026)](/blog/free-swot-competitor-analysis-template-2026)
- [Free Price Competition Analysis Template (2026)](/blog/free-price-competition-analysis-template-2026)
- [Best SEO Tool for Competitor Site Analysis (2026)](/blog/best-seo-tool-for-competitor-site-analysis-2026)
Next step
Find your real competitors.
Run a free competitor lookup and decide what to monitor next.