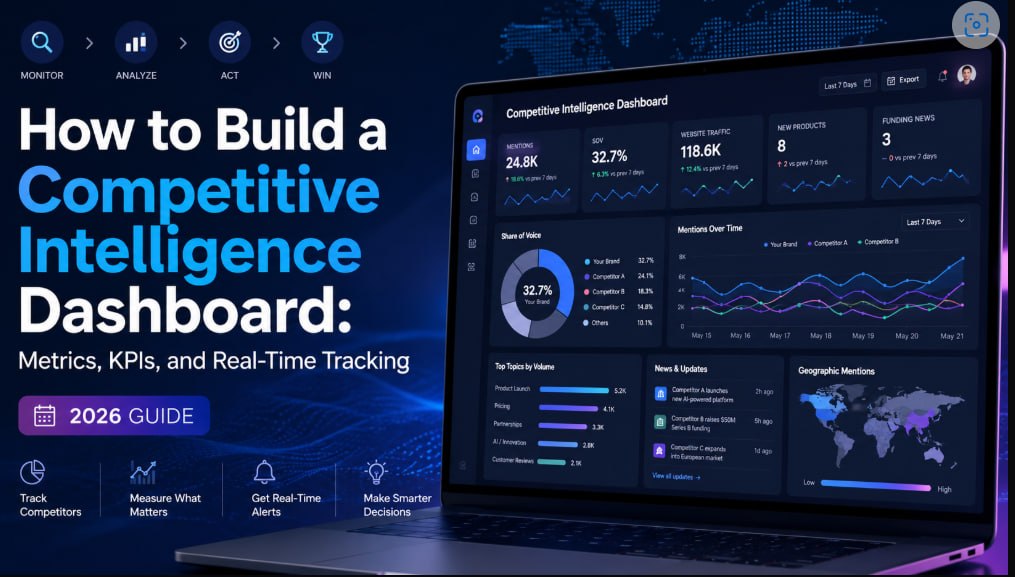
How to Build a Competitive Intelligence Dashboard: Metrics, KPIs, and Real-Time Tracking (2026 Guide)
TL;DR
- A competitive intelligence dashboard is a decision system, not a reporting tool
- Four-layer architecture: data collection, processing, visualization, and alerting
- Tracks key metrics across ads, search, content, pricing, and product launches
- Real-time tracking enables 30–50% faster market response (Gartner 2025)
Quick Answer
Building a competitive intelligence dashboard means moving from scattered competitor data to structured, decision-ready intelligence. This guide walks through the four-layer architecture, the KPIs that distinguish signal from noise, and how high-performing SaaS teams structure their systems for real-time tracking.
What a Competitive Intelligence Dashboard Actually Does
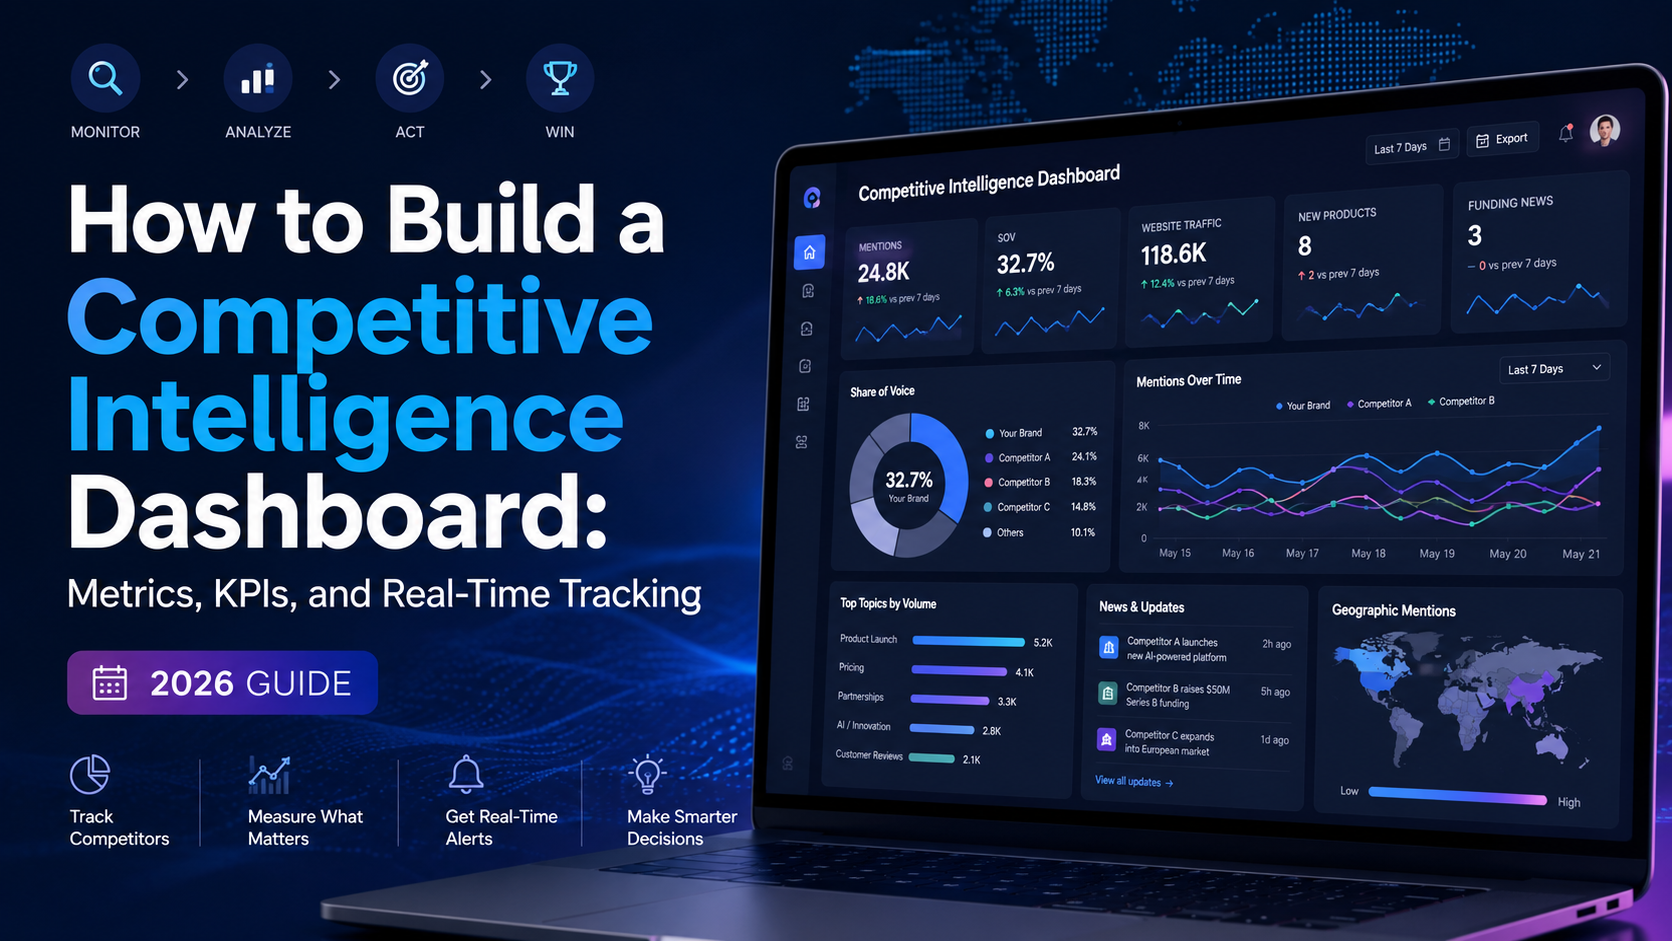
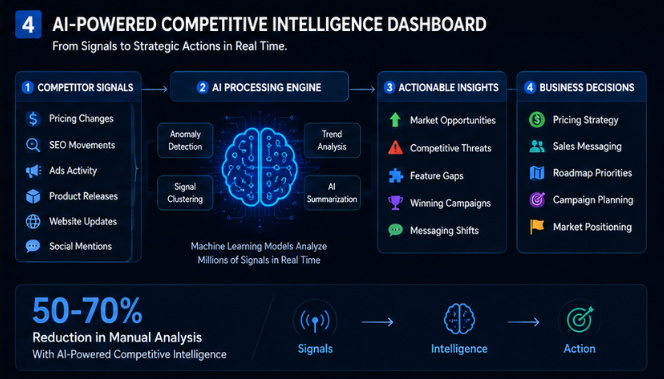
A competitive intelligence dashboard ingests raw competitor data from multiple channels and converts it into structured, decision-ready intelligence. The input side pulls from ad libraries, SERP trackers, website change monitors, content APIs, and pricing scrapers. The output side delivers real-time alerts, trend visualizations, and strategy recommendations.
According to Gartner's 2025 Digital Marketing Survey, organizations using structured competitor intelligence systems make market-response decisions 30–50% faster than those relying on manual tracking. Forrester's 2025 Competitive Strategy Benchmark found that automated CI systems reduce manual research effort by 60–80%, freeing analyst time for strategic interpretation rather than data collection.
The distinction matters: a dashboard that only visualizes data is a reporting layer. A dashboard that surfaces signals, prioritizes anomalies, and connects competitor behavior to revenue outcomes is an intelligence system.
The Four-Layer Architecture
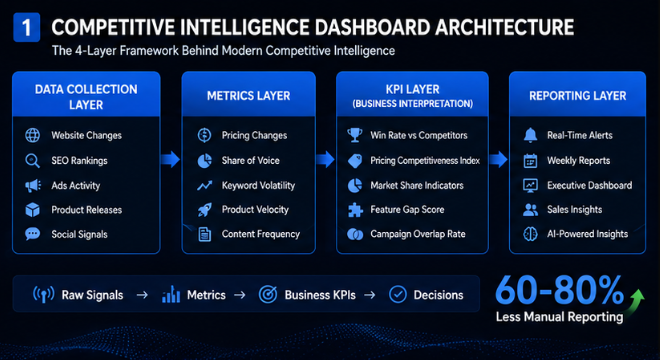
Every functional competitive intelligence dashboard operates on four layers. Skipping any layer produces either data overload (too many raw signals) or insight poverty (pretty charts with no decision value).
Layer 1: Data Collection
This is the ingestion engine. It captures competitor signals from:
- Ad libraries — Google Ads Transparency Center, Meta Ad Library, TikTok Ad Library
- Search movement — SERP rank trackers tracking keyword volatility across competitor domains
- Website changes — Pricing page updates, feature page additions, positioning language shifts
- Content publishing — YouTube upload cadence, TikTok post frequency, blog publishing velocity
- Product launches — New feature announcements, integration releases, plan tier changes
The collection layer must handle both structured API data and unstructured web content. Most teams underestimate the maintenance burden — APIs change, websites restructure, and scrapers break. This is why the McKinsey 2025 AI in Marketing Study found that the data collection layer accounts for roughly 60% of the total cost of operating a competitive intelligence system.
Layer 2: Metrics
Raw data becomes useful when it's structured into competitive intelligence metrics. The metrics that matter fall into five categories:
| Metric Category | What to Track | Business Relevance |
|---|---|---|
| Pricing Velocity | Frequency and magnitude of competitor price changes | Directly impacts win rates and deal pricing |
| Ad Intensity | Competitor ad impression share, creative rotation speed | Reveals campaign investment and market prioritization |
| SEO Volatility | Keyword ranking shifts, new content targeting | Surfaces competitor content strategy changes |
| Product Velocity | Feature release frequency, plan/iter changes | Indicates R&D investment and market expansion |
| Messaging Shifts | Positioning language changes on homepages and landing pages | Early signal of strategic pivots |
According to Forrester's 2025 CI Technology Report, high-performing teams track 5–8 metrics per competitor rather than attempting to measure everything. The discipline is in selecting metrics that connect competitor behavior to your revenue model.
Layer 3: KPIs
Metrics measure competitor activity. KPIs measure business impact. The translation layer between them is what separates operational dashboards from strategic ones.
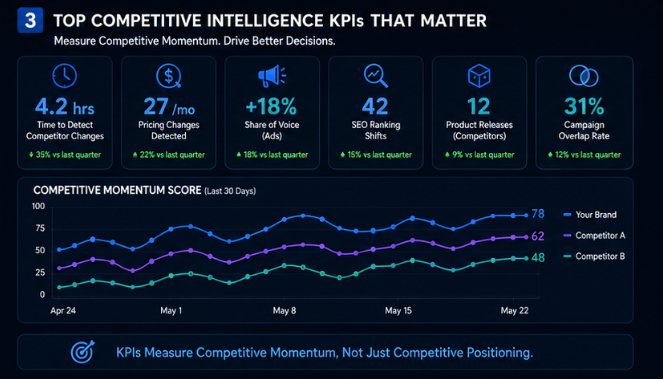
Core competitive intelligence KPIs include:
- Time-to-Detect — Hours between a competitor action and your team's awareness of it. Top-quartile teams achieve under 24 hours for pricing changes and under 48 hours for product launches.
- Win/Loss Ratio by Competitor — Deal outcomes segmented by which competitor you faced. Salesforce's 2025 State of Sales report found that teams with this KPI improve win rates by 15–30% within two quarters.
- Pricing Competitiveness Index — A composite score comparing your pricing structure against tracked competitors across plan tiers.
- Feature Gap Score — Quantitative comparison of feature parity across your product and competitor offerings.
- Campaign Overlap Rate — Percentage of your target keywords where competitors are simultaneously running paid campaigns.
Layer 4: Reporting and Action
The output layer delivers intelligence in three formats:
- Real-time alerts — Push notifications for high-priority signals (pricing changes, new ad campaigns, product launches). Delivered via Slack, email, or in-dashboard notifications.
- Weekly intelligence briefs — Structured summaries of competitor movements, trend analyses, and recommended actions.
- Executive dashboards — High-level views connecting competitor activity to revenue metrics for leadership review.
The key design principle: alerts trigger action, briefs inform strategy, dashboards enable oversight. Each format serves a distinct audience.
Intelligence Dashboard vs. Analysis Dashboard
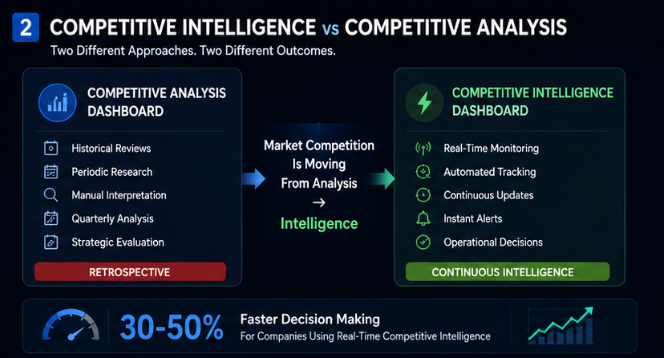
A common point of confusion: competitive intelligence dashboards and competitive analysis dashboards serve different functions.
| Dimension | Intelligence Dashboard | Analysis Dashboard |
|---|---|---|
| Data freshness | Real-time / near real-time | Periodic (weekly, monthly, quarterly) |
| Primary use | Operational decision-making | Strategic review and planning |
| Update frequency | Continuous | Scheduled |
| Alert capability | Automated push alerts | Manual review required |
| Audience | Growth teams, sales enablement, product | Strategy, leadership, board |
Intelligence is continuous and operational. Analysis is retrospective and strategic. The most effective competitor tracking systems deliver both — real-time intelligence for daily decisions and structured analysis for quarterly planning.
Real-Time Tracking: The New Baseline
The shift from periodic reporting to real-time intelligence is the single largest change in competitive intelligence between 2023 and 2026. Three data points confirm this:
- Semrush State of Search 2025: 53% of growth teams now monitor competitor ad activity weekly — up from 28% in 2023.
- BrightEdge 2025: 68% of organic traffic goes to continuously updated content, making real-time competitor content tracking a prerequisite for SEO strategy.
- Gartner 2025: Over 70% of market behavior changes appear first in ads and website updates, weeks before they impact organic search rankings.
A dashboard that updates weekly misses signals that competitors act on daily. The competitive window for responding to a pricing change or a new ad campaign is measured in hours, not weeks.
How SaaS Companies Use CI Dashboards
A representative SaaS workflow looks like this:
Input signals tracked daily:
- Competitor pricing page changes
- Google Ads and Meta Ads creative rotations
- SEO keyword ranking movements across 5–10 tracked competitors
- Product feature announcements and changelog updates
- YouTube and TikTok content publishing patterns
Output delivered to teams:
- Product team: "Three competitors adjusted enterprise pricing this week — here are the new structures"
- Sales team: "Two competitors launched case studies targeting your vertical — updated battle cards attached"
- Marketing team: "Competitor X increased ad spend on these five keywords — recommended content response"
The Salesforce 2025 State of Sales report documented that companies using structured CI dashboards react to competitive market changes 30–50% faster than those using manual tracking. The mechanism is straightforward: automated signal detection eliminates the lag between competitor action and team awareness.
The Measurement Framework
A competitive intelligence measurement framework ties dashboard activity to business outcomes. Four dimensions matter:
- Speed — Time from competitor action to team awareness. Benchmark: under 24 hours for pricing, under 48 hours for product launches.
- Coverage — Number of competitors tracked multiplied by signal types monitored. A team tracking 5 competitors across 3 signal types has 15 signal streams; expanding to 7 signal types creates 35.
- Accuracy — Signal-to-noise ratio. High-performing dashboards surface 3–5 actionable signals per competitor per week, not 50 undifferentiated data points.
- Impact — Connection to revenue decisions. The ultimate KPI: did intelligence from the dashboard change a pricing decision, a deal strategy, or a product roadmap priority?
Without this framework, dashboards become expensive visualization layers with no measurable return.
Dashboard Software and Tool Selection
Modern competitive intelligence dashboard software falls into three categories: Before building your dashboard, understand [how to gather and use competitive insights](/blog/competitive-insights-how-to-gather-and-use-competitive-intelligence-2026-guide).
| Category | Description | Best For |
|---|---|---|
| BI platforms (Looker, Tableau, Power BI) | General-purpose visualization requiring manual data pipeline construction | Enterprises with dedicated data engineering teams |
| CI-specific platforms (FollowEngine) | Purpose-built for competitor monitoring with automated signal collection, alerting, and AI-generated briefs | Growth teams that need intelligence without building pipelines |
| Hybrid stacks | BI front-end + CI data collector + internal data warehouse | Large organizations with existing BI investments |
The build-vs-buy calculus has shifted. According to Forrester 2025, maintaining a custom data collection pipeline across 5+ competitors and 5+ signal types costs $120,000–$180,000 annually in engineering time. Purpose-built competitor intelligence tools operate at a fraction of that cost by distributing the maintenance burden across a customer base.
Pair your dashboard with a [competitive landscape analysis](/blog/competitive-landscape-analysis-the-complete-2026-guide) for complete market visibility.
Frequently Asked Questions
What is a competitive intelligence dashboard?
A system that ingests competitor data from multiple channels — ads, search, content, pricing, product — and converts it into structured metrics, KPIs, and alerts that drive business decisions. It differs from a reporting dashboard in that it operates continuously rather than on a scheduled cadence.
How do teams build a competitive intelligence dashboard?
By assembling four layers: data collection (APIs, scrapers, monitors), metric definition (what to measure), KPI translation (business impact), and reporting (alerts, briefs, executive views). The collection layer represents the majority of build cost and maintenance effort.
What competitive intelligence KPIs matter most?
Time-to-detect (speed of awareness), win/loss ratio by competitor (sales impact), pricing competitiveness index (market positioning), and feature gap score (product strategy). These KPIs connect competitor behavior directly to revenue outcomes.
How is real-time tracking different from periodic reporting?
Real-time tracking surfaces signals within hours of a competitor action — a pricing change, a new ad campaign, a product launch. Periodic reporting reviews data on a weekly or monthly schedule. The competitive window for responding to market changes has compressed from weeks to hours in most SaaS categories.
What metrics should a competitive intelligence dashboard include?
Pricing change frequency and magnitude, ad intensity and creative rotation speed, SEO keyword volatility, product update velocity, and messaging/positioning shifts. High-performing teams track 5–8 metrics per competitor rather than attempting comprehensive coverage.
Can AI improve competitive intelligence dashboards?
Yes. AI-driven dashboards automatically summarize competitor changes, detect anomalies in market behavior, cluster related signals, and generate actionable insights. Industry benchmarks indicate AI reduces manual analysis time by 50–70%, freeing analyst capacity for strategic interpretation rather than pattern detection.
Start by [identifying your competitors](/blog/how-to-identify-direct-and-indirect-competitors-a-complete-2026-framework) before building the dashboard.
Conclusion
A competitive intelligence dashboard is not a visualization project. It is an operational system that connects competitor behavior to business decisions.
The four-layer architecture — collection, metrics, KPIs, reporting — provides the structural foundation. The measurement framework — speed, coverage, accuracy, impact — ensures the system produces business value rather than data noise.
The competitive advantage in 2026 is no longer access to competitor data. Every team has access to ad libraries, SERP trackers, and web scrapers. The advantage lies in how quickly a team detects changes, connects them to KPIs, and acts — before the competitor's next move resets the board.
About the Author
Dylan Dan Founder & CEO, FollowEngine
Dylan Dan is the founder of FollowEngine, bringing over 10 years of experience in competitive intelligence and competitor analysis. He has helped hundreds of businesses build structured CI programs that turn market signals into revenue decisions.
Related Articles
- [Win Loss Analysis: The Real Reason You're Losing Deals (And How to Fix It)](/blog/win-loss-analysis-the-real-reason-youre-losing-deals-and-how-to-fix-it)
- [](/blog/tid0nudx1lpkqx9gjdas)
- [The Free SaaS Competitor Analysis Template That Ships — 10 Fields, 3 Tabs, One Weekly Habit](/blog/the-free-saas-competitor-analysis-template-that-ships-10-fields-3-tabs-one-weekly-habit)
Next step
Find your real competitors.
Run a free competitor lookup and decide what to monitor next.